Reports & dashboard
Omni Store turns your day‑to‑day activity into numbers you can act on. There are two places to look: the Dashboard for a quick pulse, and Reports for detail.
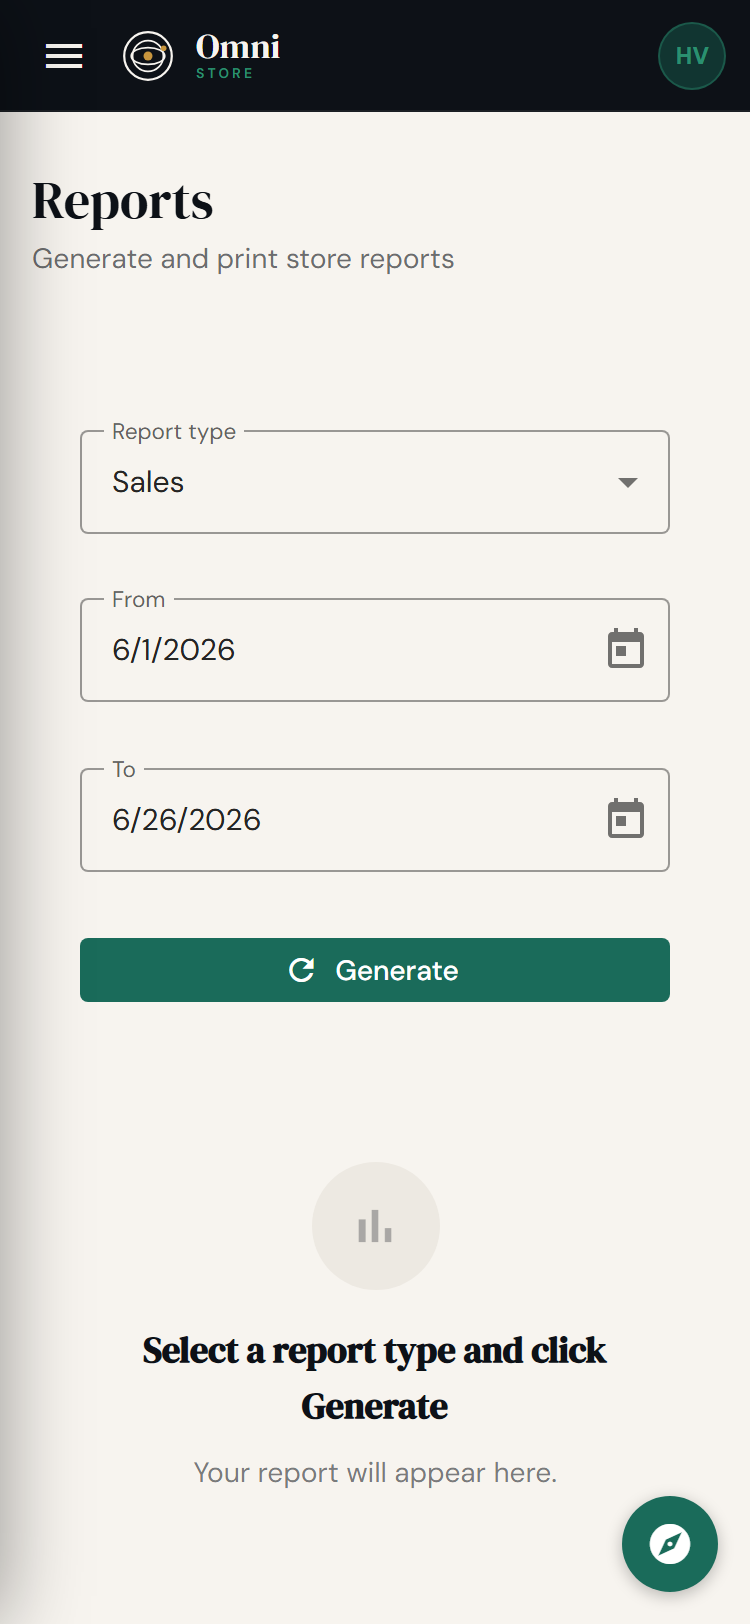
Mobile view
The dashboard
The Dashboard is the first thing you see when you sign in. It gives an at‑a‑glance summary of how your store is doing - recent sales, key totals, and activity - so you can start the day informed without digging.
All roles can see the dashboard, though some figures depend on role.
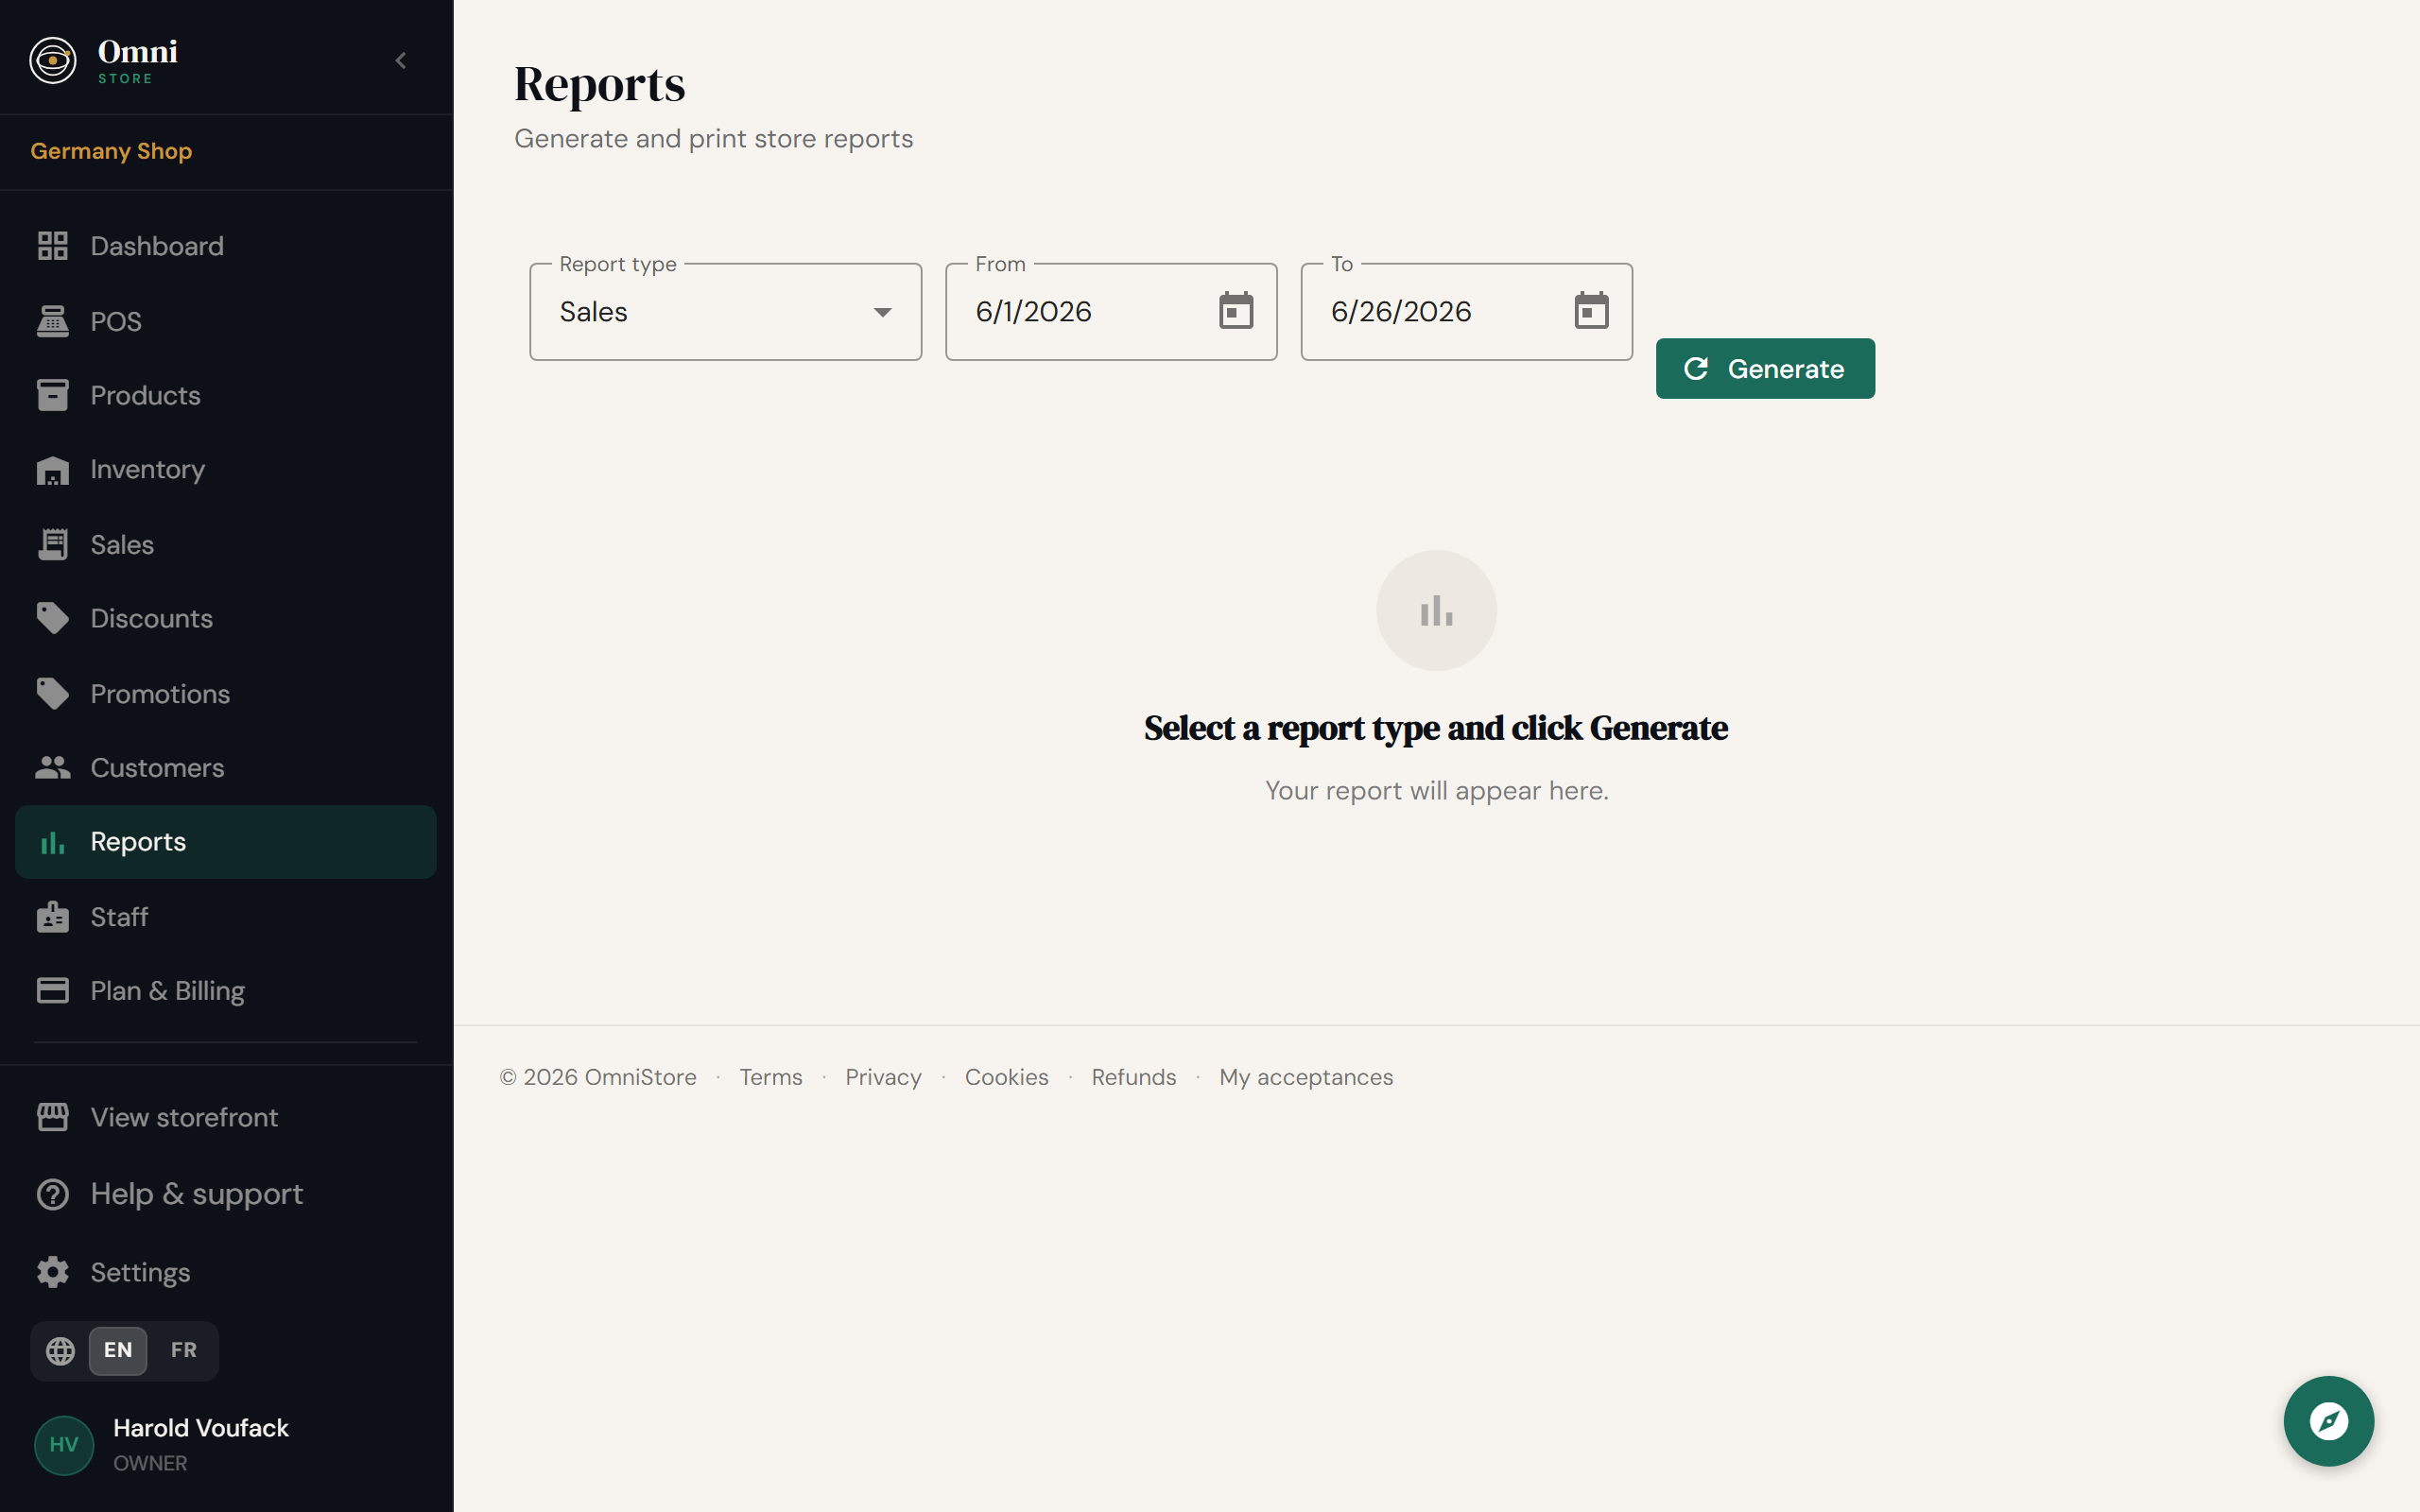
Reports
Under Reports you'll find deeper breakdowns:
- Sales report - revenue over time, by product, and by payment method. If you've entered cost prices on your products, you'll also see profit, not just revenue.
- Inventory report - stock on hand, low‑stock items, and the value of your inventory.
- Staff report - sales and activity by team member, so you can see who's performing and staff your busy periods.
Date ranges
Plan required Choosing custom date ranges (any start and end you like) is available from the Team plan upward. On entry plans you get standard preset ranges. See Plans & pricing.
Use date ranges to compare like‑for‑like: this week vs. last week, this month vs. the same month last year.
Scheduled reports
Plan required On the Team plan and above, you can have reports delivered on a schedule - for example, a weekly sales summary by email - so you don't have to remember to pull them.
Advanced analytics
Enterprise The top plan adds advanced analytics such as customer cohort retention and lifetime‑value (LTV) forecasts, for understanding how customer groups behave over time.
Profitability tracker
For deeper margin analysis - breakdowns by category, tag, promotion, staff, and customer, plus shrinkage tracking and floor prices - see the Profitability tracker under Apps.
Making reports useful
- Fill in cost prices so profit appears, not just sales (see Products).
- Attach customers to sales so customer‑level insight is possible (see Customers).
- Check inventory value regularly so you know how much cash is tied up in stock.
- Watch the staff report to schedule the right people at the right times.